
What VoltGuard does
Inspection and reporting only. VoltGuard does not perform repairs, installations, or hands-on electrical work, so the findings stay independent.
Electrical thermography
Infrared scans of energized equipment to spot hotspots and failing components that look normal to the eye.
Preventative maintenance inspections
- Panel inspections
- Torque checks
- Disconnect evaluations
- Breaker assessments
- Equipment condition reviews
Insurance and risk-control reporting
Documentation written for carriers, brokers, and property managers.
Why facilities choose VoltGuard
Dominic Reed is a Florida journeyman electrician and a Level II certified thermographer, so he knows what he is looking at.
- Level II certified thermographyASNT SNT-TC-1A (2020), certification #260426-1.
- Hands-on commercial and industrial experienceYears in the field as a journeyman electrician.
- NFPA 70B-aligned reportingBuilt for insurers and risk managers.
- Reports without upsellingYou get findings and recommended actions, not a sales pitch.
- Early detectionHotspots, loose terminations, overloaded circuits, and failing breakers.
Who VoltGuard works with
Facilities where unplanned downtime or an electrical fire costs the most.
- Commercial properties
- Industrial facilities
- Manufacturing
- Warehouses and distribution
- Property management groups
- Insurance carriers and brokers
What you receive
Every finding gets its own one-page report with the thermal image, the measurements, a severity class, and the corrective action.
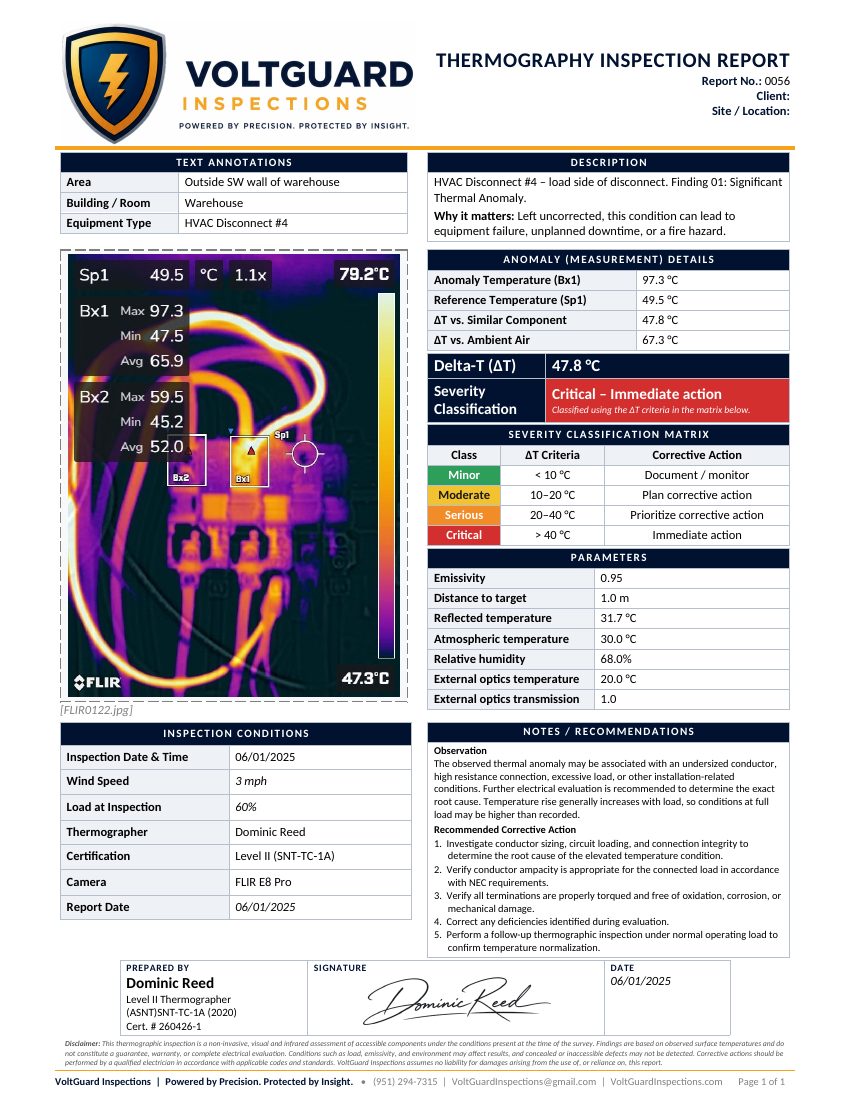
Severity is set by how far a component runs above a similar one under the same load. The sample on this page is a 47.8 °C difference, which falls in the top class.
Each report also lists the emissivity, distance, reflected temperature, and humidity used for the scan, plus the date, load at inspection, and the thermographer who signed it.